
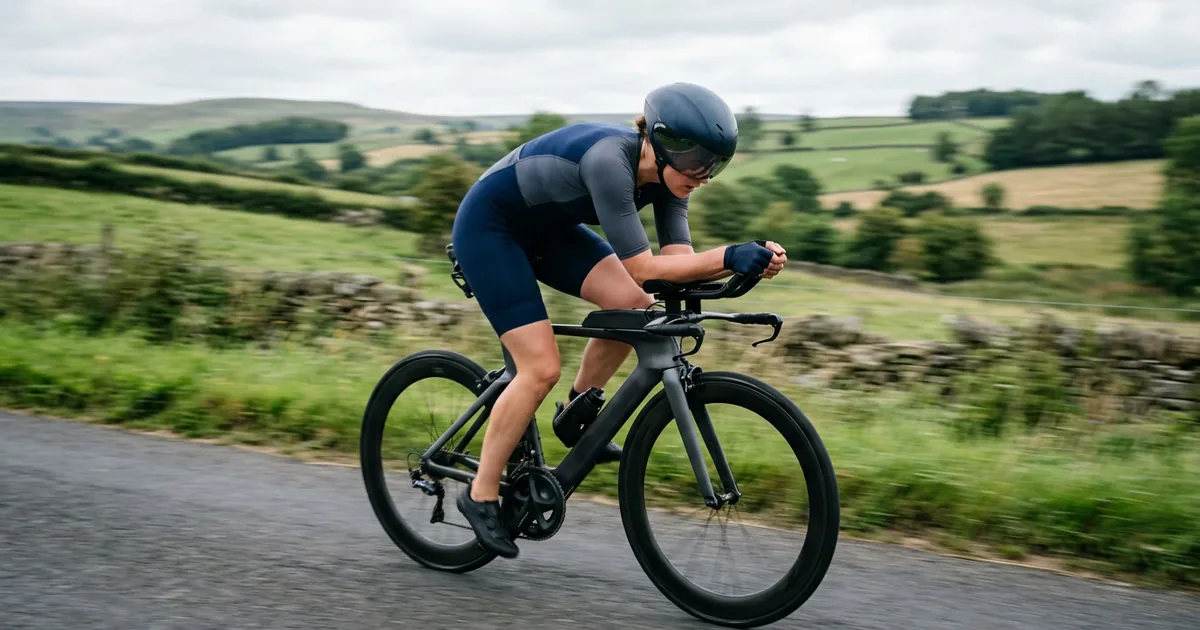
The bike is the longest leg of a triathlon and the easiest one to ruin the rest of your race with. Ride it 6% harder than you should and you will arrive in T2 with a bike split you are pleased about and a marathon you cannot run.
This is the least intuitive part of long-course racing. On the bike, going harder makes the clock move in the direction you want. The cost is deferred, it lands on the run, and by the time you can feel it there is nothing you can do about it. So the question "how many watts should I ride?" is really a question about the whole race, not the bike leg.
Quick answer: Ironman and 70.3 bike intensity
Ride a full-distance Ironman at an intensity factor of 0.68-0.72 of FTP, and a 70.3 at 0.76-0.80. For a 250 W athlete that is roughly 175 W for an Ironman and 195 W for a 70.3. Stronger, more experienced athletes sit at the top of each band; first-timers and anyone racing in heat should sit at the bottom. Model your own numbers with the bike split calculator.
Key takeaways
- Intensity factor, not watts, is the number that transfers between athletes. Ride a percentage of your own FTP.
- In our own model, riding a 70.3 "strong" rather than "controlled" saves 4:05 on the bike and costs 6:20 on the run.
- Overbiking a full-distance race saves 17 minutes on the bike and costs 32 minutes on the run - a net loss of over 14 minutes, and that is before the fuelling consequences.
- Variability index matters as much as average power. A surging ride at the right average costs more than a steady one.
- Without a power meter, pace off heart rate ceilings and the ability to hold a conversation, and treat the first hour as deliberately too easy.
Intensity factor is the only number that travels
Watts are personal. Telling an athlete to ride 200 W is meaningless without knowing their threshold, and it is why forum answers to "what should I ride?" are so often useless. Functional threshold power - roughly the power you could hold for an hour - is the reference every other number hangs off.
Intensity factor is simply your target power divided by your FTP. An IF of 0.70 means riding at 70% of threshold. Because it is a ratio, it transfers between a 180 W athlete and a 320 W athlete without modification, which is why every coaching system expresses race intensity this way.
These are the intensity factors this site's calculators use as defaults, and they line up with conventional age-group practice:
| Race distance | Intensity factor | 250 W athlete rides | Why |
|---|---|---|---|
| Sprint | 0.88 | 220 W | The run is only 5 km; there is little to protect. |
| Olympic | 0.84 | 210 W | A 10 km run tolerates a hard bike, but not a maximal one. |
| 70.3 | 0.78 | 195 W | A half marathon off the bike punishes over-effort sharply. |
| Ironman 140.6 | 0.70 | 175 W | The marathon decides the race; the bike exists to protect it. |
Notice the direction: the longer the race, the lower the intensity. That is not caution for its own sake. It is because the run leg grows faster than the bike leg does, so the amount of race left to ruin gets bigger.
What overbiking actually costs, in minutes
This is the part that arguments on forums rarely settle, because both sides are describing something real: the bike genuinely does get faster when you push, and the run genuinely does fall apart. The only way to resolve it is to price both at once.
Below is that calculation, run through this site's own bike split model and run-off-the-bike model together. The athlete is 75 kg with a 250 W FTP on a rolling course in a tri position, whose standalone half-marathon pace is 5:00/km. Only bike intensity changes.
| 70.3 bike effort | IF / watts | Bike split (vs controlled) | Run split (vs controlled) | Bike + run |
|---|---|---|---|---|
| Easy | 0.72 / 180 W | 2:53:38 (+5:25) | 2:00:36 (-2:49) | 4:54:14 (+2:36) |
| Controlled | 0.78 / 195 W | 2:48:13 | 2:03:25 | 4:51:39 (fastest) |
| Strong | 0.83 / 208 W | 2:44:08 (-4:05) | 2:09:45 (+6:20) | 4:53:53 (+2:14) |
| Overbike | 0.88 / 220 W | 2:40:43 (-7:31) | 2:19:15 (+15:49) | 4:59:57 (+8:19) |
Read the Overbike row carefully. Riding 25 watts harder than the controlled plan produces a bike split 7 minutes and 31 seconds faster - a gain you would feel good about at the dismount line. It also produces a run 15 minutes and 49 seconds slower. The net result is 8 minutes and 19 seconds lost against the controlled ride, and a far worse experience along the way.
The full distance is more brutal still, because the marathon has twice as long to express the damage:
| Ironman bike effort | IF / watts | Bike split (vs controlled) | Marathon split (vs controlled) | Bike + run |
|---|---|---|---|---|
| Easy | 0.64 / 160 W | 6:02:25 (+11:46) | 4:32:52 (-5:38) | 10:35:17 (+6:08) |
| Controlled | 0.70 / 175 W | 5:50:39 | 4:38:29 | 10:29:08 (fastest) |
| Strong | 0.75 / 188 W | 5:40:42 (-9:57) | 4:51:09 (+12:40) | 10:31:50 (+2:42) |
| Overbike | 0.80 / 200 W | 5:33:20 (-17:19) | 5:10:08 (+31:39) | 10:43:28 (+14:20) |
Twenty-five watts above plan buys 17 minutes and 19 seconds of bike split and gives back 31 minutes and 39 seconds of run, for a net loss of 14 minutes and 20 seconds. The marathon pace degrades from 6:36/km to 7:21/km - and that is the model's tidy version, in which you still run the whole way. The real version of an overbiked Ironman marathon usually involves walking aid stations, and the losses stop being predictable.
Two honest caveats. First, these are model outputs, not measurements from a field study: they come from a power-balance bike model and a durability penalty calibrated to typical age-group outcomes, and your own penalty may be smaller if you have trained specifically for it. Second, the "Easy" row shows that riding too conservatively also costs time - the relationship is a curve with an optimum, not a rule that slower is always better. What the numbers support is not timidity, it is precision.
Variability index: how you spend the watts, not just how many
Two riders can finish with the same average power and arrive at T2 in completely different states. The one who rode steadily has spent less physiological cost than the one who coasted the descents and hammered every rise, even when the averages match.
The metric for this is variability index - normalized power divided by average power. A VI of 1.00 is a perfectly even ride. Long-course racing wants a VI of 1.05 or below; anything above about 1.10 means you rode a series of intervals rather than a race.
| Variability index | What it means | Typical cause |
|---|---|---|
| 1.00-1.03 | Excellent for long course | Flat course, disciplined rider |
| 1.04-1.05 | Good; the realistic target on rolling terrain | Rolling course, steady effort |
| 1.06-1.10 | Acceptable on a hilly course, costly on a flat one | Real climbing, or mild surging |
| Above 1.10 | You rode intervals; expect it on the run | Surging, chasing passes, hard climbs |
The practical rule on hills: let your power rise modestly on climbs and let your speed fall. A common target is to allow up to about 105% of your race intensity on a sustained climb and to keep pedalling lightly rather than coasting on the descent. The instinct to hold speed on a climb is what pushes VI up, and it is expensive.
Pacing without a power meter
Most age-group athletes do not race with power, and the advice above still applies - it just needs different instruments.
- Heart rate ceiling. Set a cap rather than a target, because heart rate drifts upward through a long race even at constant effort. For a full distance, most athletes are looking at the top of Zone 2; for a 70.3, low Zone 3. Read heart rate vs power vs pace for how cardiac drift changes what the number means after four hours.
- The conversation test. If you cannot speak a full sentence comfortably, you are riding an Ironman too hard. This is cruder than power and surprisingly reliable.
- The first-hour rule. Ride the first hour at an effort that feels clearly too easy. Adrenaline, fresh legs and the athletes streaming past you all conspire to make the correct effort feel wrong early on. Every experienced long-course athlete has learned this the expensive way.
- Perceived exertion. On a 1-10 scale, a full distance is a 5-6 for the first half and no more than a 7 at the end. A 70.3 sits at 6-7 throughout.
Bike pacing and fuelling are the same decision
Intensity does not only cost you muscular fatigue; it changes the fuel you burn and your ability to absorb more. Riding harder shifts you toward carbohydrate and away from fat, so your finite glycogen empties faster - which is the mechanism behind bonking.
Worse, higher intensity reduces blood flow to the gut, so the point at which you most need carbohydrate is also the point at which you are least able to take it on. This is why overbiking so often shows up as a nutrition failure: the athlete did not eat less, they simply stopped being able to process what they ate.
The practical consequence is that your fuelling plan assumes your pacing plan. Work out hourly carbohydrate with the nutrition calculator, then commit to the intensity that plan was built for. If you decide on the bike to ride harder than planned, you have also quietly decided to fuel worse.
Adjusting for course and conditions
The intensity bands above assume a rolling course in reasonable weather. Three things should move you toward the bottom of your band:
- Heat. Hot racing raises heart rate at any given power and accelerates fluid loss. Drop your target intensity rather than trying to hold a number that no longer means what it did in training, and check what the conditions do to your run with the heat pace calculator.
- Hills. Climbing raises the cost of holding average power because you cannot recover on the descents the way flat-course riders imagine. Use the course adjustment calculator to see what the terrain does to a realistic split.
- It is your first race at the distance. Your durability is unknown, which means the run penalty is unknown. Ride the conservative end and find out what you can handle with data rather than optimism.
Position matters too, and it is often worth more than watts. Getting genuinely aero saves time without any physiological cost at all, which is the only free speed in the sport - the aerodynamics guide covers what actually moves the needle.
A checklist for race morning
- Know your target intensity as a wattage range, not a single number, and write it on your top tube.
- Deliberately ride the first 30 minutes below the range. Let people pass you.
- Check your average every 30 minutes rather than staring at instantaneous power, which is noisy and invites chasing.
- On climbs allow up to about 105% of target; on descents keep pedalling rather than coasting.
- Eat and drink on schedule, not by feel, because appetite disappears before the need does.
- In the last 30 km, resist the urge to spend what you have left. That reserve is your marathon.
Then model the whole thing before race week: build the bike split in the bike split calculator, feed it into the run-off-the-bike calculator, and check the total against the Ironman pace calculator. If the plan only works when everything goes right, it is not a plan.