
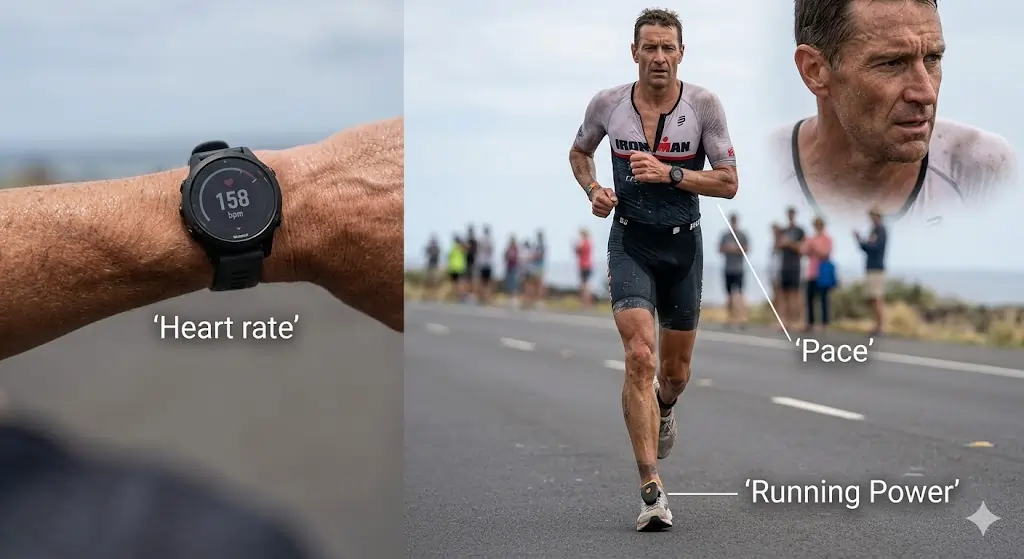
You're standing at the Ironman start line. Your watch is loaded with data fields. Your coach gave you targets. Your training files are full of numbers.
But when the gun fires, one question paralyzes age-groupers: Which metric should I actually follow?
Do you trust the heart rate monitor that lags behind your effort? The power meter that doesn't account for hills or wind? The pace target that ignores fatigue, heat, and course profile?
Here's the truth most pacing guides miss: Heart rate, power, and pace don't compete. They complete each other. But only if you know which one to prioritize, when to switch, and how to interpret conflicts. In this paradigm, raw inputs like heart rate, power, and pace targets are mere raw variables—the Tri Split Calculator serves as your master race execution system to model environmental and physiological shifts into a single, executable pacing plan.
This pillar guide breaks down the physiology, practical application, and race-day decision framework for using heart rate, power, and pace in an Ironman. You'll learn:
- What each metric actually measures (input vs. output vs. physiological response)
- Why single-metric pacing fails over 140.6 miles
- Discipline-specific prioritization frameworks
- How to build a "Primary → Secondary → Governor" pacing system
- Real-time conflict resolution when metrics disagree
- Training protocols to align your data before race day
Ready to turn your raw power inputs into an execution plan? Use our free Tri Split Calculator to align heart rate zones, power targets, and pace goals into a single, executable timeline.
Table of Contents
- 1. The Triad Defined: Input, Output, and Response
- 2. Why Single-Metric Pacing Fails in an Ironman
- 3. Discipline-by-Discipline: Which Metric Wins?
- 4. The Integration Framework: Primary, Secondary, Governor
- 5. Environmental & Physiological Modifiers
- 6. Training to Align Your Metrics
- 7. Race-Day Execution & Conflict Resolution
- 8. Common Mistakes & How to Avoid Them
- 9. Frequently Asked Questions
- 10. Tools to Build Your Metric-Integrated Race Plan
1. The Triad Defined: Input, Output, and Response
Before choosing a pacing metric, you must understand what it actually measures. Confusing these categories is where most pacing errors begin.
| Metric | What It Measures | Category | Real-Time Lag | Best For |
|---|---|---|---|---|
| Power (watts) | Mechanical work output | Input | Near-zero (0.5-2 sec) | Objective effort quantification, terrain adjustment, pacing discipline |
| Pace (min/mi or min/km) | Speed over ground | Output | Instant (GPS-dependent) | Flat courses, run/swim efficiency, time-goal tracking |
| Heart Rate (bpm) | Cardiovascular/physiological response | Response | 10-60 seconds (lags behind effort) | Fatigue tracking, hydration/heat monitoring, systemic load |
The Crucial Distinction
- ⚡ Power tells you what you're doing.
- 🎯 Pace tells you what you're achieving.
- ❤️ Heart Rate tells you how your body is handling it.
In a controlled lab or flat time trial, these align closely. In an Ironman, they diverge constantly due to fatigue, environment, course profile, and cumulative stress. Your pacing strategy must account for this divergence, not ignore it.
2. Why Single-Metric Pacing Fails in an Ironman
The "Steady-State" Illusion
Training often happens on predictable loops: steady loops, controlled intervals, repeatable conditions. Race day doesn't. An Ironman introduces compounding variables:
- Cardiac drift: Heart rate rises 5-15 bpm over hours 3-6 despite constant power.
- Environmental drag: Headwinds, heat, humidity, and elevation alter pace independently of effort.
- Fatigue accumulation: Neuromuscular efficiency drops, raising metabolic cost at same power/pace.
- Nutrition/GI status: Dehydration or fueling deficits elevate HR, suppress power, distort pace perception.
Relying on one metric ignores these realities. The result? Overexertion, premature bonking, or unnecessarily conservative racing.
The Data Conflict Matrix
| Scenario | Power Says | Pace Says | HR Says | What Actually Happens |
|---|---|---|---|---|
| Climbing a hill | 220W (above target) | 8 mph (slower) | Rising steadily | Normal; power/pace diverge, HR tracks load |
| Headwind on flats | 200W (on target) | 14 mph (slower) | Slightly elevated | Pace drops, effort constant; don't chase speed |
| Heat + dehydration | 195W (on target) | Normal | +10 bpm drift | Systemic strain rising; reduce effort or hydrate |
| Late-race fatigue | 185W (below target) | 9:30/mile (slower) | High but steady | Power drops to preserve effort; athlete should reassess pacing manually |
👉 Key insight: Conflicting metrics aren't a problem. They're data. Learn to read them together.
3. Discipline-by-Discipline: Which Metric Wins?
Swim: Pace + RPE (Power Doesn't Exist, HR Is Unreliable)
Why: Open water conditions, drafting, sighting, and chop make pace highly variable. HR is skewed by adrenaline, breath-holding, and wetsuit compression.
- 🟢 Primary: Target pace per 100m/100yd (adjusted for conditions)
- 🟡 Secondary: Stroke rate + breathing rhythm
- 🔴 Governor: RPE (1-10 scale) + perceived exertion
- ⚪ HR: Ignore early; use only post-swim to assess recovery
Execution tip: Draft when possible. Sight efficiently. Exit feeling controlled, not exhausted. Pace will fluctuate; effort should not.
Bike: Power (Primary) + HR (Secondary) + Speed (Context Only)
Why: Power meters provide immediate, objective feedback unaffected by wind or gradient. HR confirms systemic load. Speed is useful only for flat, calm conditions.
- 🟢 Primary: Normalized Power (NP) or Instantaneous Power at 70-85% FTP
- 🟡 Secondary: Heart rate trend (watch for drift)
- 🔴 Governor: RPE + perceived leg freshness
- ⚪ Speed: Context only; never chase it into wind or hills
Execution tip: Use rolling NP (30-min) as your pacing governor. Allow instantaneous power to vary with terrain. If HR drifts >10 bpm without power change, check hydration/heat.
Run: Pace (Primary) + HR (Secondary) + Power (Optional) + RPE (Essential)
Why: Running pace is highly correlated with performance goals, but environmental factors and fatigue distort it. HR tracks systemic stress. Running power meters exist but are less standardized. RPE captures cumulative fatigue.
- 🟢 Primary: Target pace per mile/km (adjusted for course/conditions)
- 🟡 Secondary: Heart rate zone (monitor drift)
- 🔴 Governor: RPE + cadence + form quality
- ⚪ Power: (if available) Use as trend monitor, not strict target
Execution tip: Start 5-10 sec/mile slower than goal. Implement walk breaks strategically. Let pace slow on hills/heat; recover on downhills. Trust effort over pace early.
4. The Integration Framework: Primary, Secondary, Governor
Instead of choosing one metric, use a tiered system that adapts to race conditions.
The Pacing Hierarchy
| Tier | Role | Example (Bike) | Example (Run) |
|---|---|---|---|
| Primary | Objective target to hold | Power: 190-200W | Pace: 9:15-9:30/mi |
| Secondary | Confirmation & trend monitoring | HR: 145-155 bpm (watch drift) | HR: 150-160 bpm (accept +5-10 drift late) |
| Governor | Safety valve & real-time adjuster | RPE 5-6/10; adjust if >7 | RPE 6-7/10; walk if form breaks |
How to Use the Framework
- Set your Primary target based on FTP, training data, and course profile.
- Monitor your Secondary metric to confirm physiological alignment.
- Let your Governor override when metrics conflict or conditions change.
- Reassess every 20-30 minutes (or at aid stations).
Pro tip: Program your head unit/watch to display Primary + Secondary prominently. Keep Governor as a mental check, not a data field.
When to Switch Priority
| Condition | Shift Priority To | Why |
|---|---|---|
| Extreme heat/humidity | HR + RPE | Cardiovascular strain rises; power/pace become misleading |
| Very hilly course | Power + RPE | Pace is useless on climbs; power adjusts intelligently |
| Late-race fatigue (hour 8+) | RPE + Pace | Power may drop naturally; focus on maintaining form/pace |
| GI distress/dehydration | HR + RPE | Systemic stress elevated; reduce effort regardless of power/pace |
| Headwinds/tailwinds | Power + RPE | Pace swings wildly; effort should remain steady |
5. Environmental & Physiological Modifiers
Cardiac Drift: The Silent Pace Killer
What it is: Heart rate rises over time despite constant power/pace, due to dehydration, heat, glycogen depletion, and reduced stroke volume.
Impact: Can add 10-15 bpm by hour 4 of the bike, 8-12 bpm by mile 20 of the run.
How to handle it:
- Expect it; don't panic.
- Reduce power/pace by 3-5% if HR exceeds zone +10 bpm for >15 minutes.
- Prioritize hydration/electrolytes.
- Trust RPE over HR late in the race.
Heat & Humidity: The Effort Multiplier
What it does: Increases core temperature, raises HR, reduces sweat efficiency, impairs gut absorption.
Metric impact:
- HR rises 5-10 bpm per 10°F above 65°F.
- Power sustainable drops ~2-4% per 5°F above 75°F.
- Pace slows 5-15 sec/mile despite same effort.
Adjustment protocol:
- Reduce target power by 5-8% in >80°F.
- Extend aid station stops; sip electrolytes, don't chug.
- Switch primary focus to HR + RPE; ignore pace targets.
Altitude & Oxygen Availability
Rule of thumb: Sustainable power drops ~1-2% per 1,000 ft above 5,000 ft.
Race-day fix:
- Pre-race: Reduce FTP-based targets by 5-10%.
- Monitor: HR will be elevated; RPE will feel higher.
- Pace: Will slow; accept it as physiological reality, not failure.
Wind & Course Profile
Wind: Headwinds increase power demand for same speed. Tailwinds reduce it. Crosswinds increase drag and handling stress.
Elevation: Climbing raises power cost exponentially. Descending allows recovery.
Solution: Use power as your constant. Let pace fluctuate. Adjust NP targets slightly for extreme gradients. Never chase speed into wind or up hills.
6. Training to Align Your Metrics
Race-day confidence comes from training-day calibration. Use these protocols to align your metrics before race season.
Step 1: Establish Baselines
| Metric | Test Protocol | Frequency |
|---|---|---|
| FTP (Bike) | 2x20-min or ramp test × 0.95 | Every 8-12 weeks |
| CSS (Swim) | 1,000m time trial ÷ 10 | Every 6-8 weeks |
| Threshold HR | 30-min time trial × 0.95 | Every 8-12 weeks |
| Race Pace | Recent half-marathon or brick run | Every 6-8 weeks |
Step 2: Cross-Calibrate in Long Bricks
Practice holding targets while monitoring all three metrics:
Track:
- Power consistency (rolling NP)
- HR trend (note drift after hour 1.5)
- Run pace vs. RPE (how much does pace drop off bike?)
- Hydration/nutrition impact on all three
Step 3: Simulate Race Conditions
- Heat training: Practice at race-time temperature; note HR/power shifts.
- Hill repeats: Learn how power varies with gradient while maintaining RPE.
- Wind sessions: Practice holding power despite pace swings.
- Fatigue rehearsals: Train after poor sleep, heavy nutrition load, or back-to-back long days.
Step 4: Build Your Personal "Drift Profile"
Track how your metrics change over time in training:
| Hour | Avg Power | Avg HR | Pace/Speed | RPE | Notes |
|---|---|---|---|---|---|
| 1 | 195W | 142 bpm | 20.1 mph | 4 | Fresh, controlled |
| 2 | 198W | 146 bpm | 19.8 mph | 5 | Normal drift |
| 3 | 192W | 151 bpm | 19.3 mph | 6 | Hydration focus |
| 4 | 188W | 155 bpm | 18.9 mph | 7 | Reduce target 3% |
👉 Use this data in the Tri Split Calculator to auto-adjust race-day targets based on your personal drift profile.
7. Race-Day Execution & Conflict Resolution
The Decision Matrix: When Metrics Disagree
| Conflict | Likely Cause | Action |
|---|---|---|
| Power on target, HR high | Heat, dehydration, caffeine, fatigue, cardiac drift | Reduce effort 3-5%; hydrate; trust RPE |
| Power low, HR low, pace slow | Under-fueling, fatigue, conservative pacing | Gradually build if feeling good; don't surge |
| Power high, pace normal, HR spiking | Headwind, climbing, surge | Hold power; ignore pace; monitor HR trend |
| HR normal, pace fast, power low | Tailwind, downhill, drafting | Enjoy the free speed; don't push harder |
| All metrics high, RPE very high | Systemic overload, GI distress, overexertion | Slow immediately; walk if needed; fuel/hydrate |
Real-Time Adjustment Protocol
- Pause: Take 3 deep breaths. Don't react impulsively.
- Identify: Which metric is the outlier? What's the likely cause?
- Adjust: Apply the appropriate fix from the matrix.
- Monitor: Check trend over next 10-15 minutes.
- Reset: Return to Primary target when stable.
The "Rule of 15"
If two metrics conflict for >15 minutes, default to RPE. Your nervous system integrates all inputs (muscle fatigue, core temp, hydration status, mental load) faster than any single device.
8. Common Mistakes & How to Avoid Them
Mistake #1: Chasing Pace Into Headwinds or Hills
Problem: Trying to hold 15 mph into a 20 mph headwind.
Result: Power spikes, HR rises, glycogen depletes.
Fix: Hold power target. Accept slower pace. Recover on tailwinds/descents.
Mistake #2: Panicking Over Cardiac Drift
Problem: Slowing down because HR is "too high" despite steady power.
Result: Leaving time on the course unnecessarily.
Fix: Expect drift. Reduce effort only if RPE exceeds 7/10 or HR stays >10 bpm above zone for >20 min.
Mistake #3: Over-Reliance on Power Without Context
Problem: Holding 200W FTP-based target in 90°F heat.
Result: Dehydration, GI distress, run collapse.
Fix: Apply environmental modifiers. Use HR/RPE as governors.
Mistake #4: Ignoring the Run Off-the-Bike Pace Drop
Problem: Expecting marathon pace to match standalone race pace.
Result: Starting too hard, positive splitting, walking late.
Fix: Accept 10-30 sec/mile slower off bike. Start conservative. Build if possible.
Mistake #5: Not Practicing Metric Integration in Training
Problem: Only training with one metric, then racing with all three.
Result: Confusion, poor decisions, missed targets.
Fix: Train with your full race setup. Practice conflict resolution. Rehearse adjustments.
👉 Avoid these traps: Model metric interactions at the Tri Split Calculator and rehearse in long brick workouts.
9. Frequently Asked Questions
Q: Which is more important for Ironman pacing: power or heart rate?
A: Power is superior for objective pacing on the bike. Heart rate is essential for monitoring systemic load, heat stress, and fatigue. Use power as your primary, HR as your secondary, and RPE as your governor.
Q: Can I pace an Ironman with heart rate alone?
A: Yes, but with caveats. HR lags behind effort, drifts with fatigue, and doesn't account for terrain. Compensate by training extensively with HR zones, using RPE heavily, and accepting that pace/power will vary.
Q: Should I use a running power meter?
A: Optional. Running power accounts for hills and fatigue better than pace, but it's less standardized than cycling power. If you use one, treat it as a trend monitor, not a strict target. Pace + RPE remains the gold standard for most age-groupers.
Q: How do I handle metric conflicts late in the run?
A: Default to RPE and form. If legs feel heavy and HR is high, slow down. If you feel strong but pace is slow, trust your training. Use aid stations to reset, hydrate, and reassess every 2-3 miles.
Q: Does caffeine affect these metrics?
A: Yes. Caffeine elevates HR by 3-8 bpm, may slightly increase perceived power output, and can improve pace perception. Factor this into your HR targets; don't panic if HR is elevated after caffeine intake.
Q: What if my power meter or HR strap fails mid-race?
A: Have a backup plan. Switch to pace + RPE. Use known effort thresholds (e.g., "conversational pace," "can sustain for hours"). Practice racing with minimal tech in at least one long training session.
10. Tools to Build Your Metric-Integrated Race Plan
Understanding the triad is step one. Executing a personalized, condition-aware pacing strategy is step two.
Tri Split Calculator vs. Generic Static Charts
Generic pacing charts assume a static, linear world. Here is why modern athletes rely on the Tri Split Calculator to integrate their metrics:
| Feature | Static Coaching Charts | Tri Split Calculator |
|---|---|---|
| Metric Synchronization | Separate zones mapped manually | Connects pace, FTP bike split, run-off-bike, heat, and nutrition tools |
| Environmental Scaling | None (assumes zero heat or wind) | Heat pace calculator adjusts run pace; bike page uses simple course modifiers |
| Drift Modeling | Ignored (assumes flat fatigue lines) | Run-off-bike and heat tools estimate durability and condition penalties |
| Actionable Hour Guide | Generic zones listed | Exports PDFs from calculators, nutrition planner, and race checklist |
Embedded Pacing Model (Input → Output Transformation)
Here is a real-world example of how the TriSplitCalc tools turn raw training metrics into a practical race-day planning estimate:
📥 Athlete Inputs
📤 Calculator Outputs
Start planning now: Visit https://trisplitcalc.com/ to build a free, transparent, power-aware Ironman planning estimate.
Disclaimer: This content is for educational purposes. FTP testing and power-based training should be approached progressively. Consult a certified triathlon coach or sports scientist before making significant changes to your training, especially if you have cardiovascular or metabolic conditions. © 2026 TriSplitCalc.com. All rights reserved. Build your power-based race plan at https://trisplitcalc.com/.