
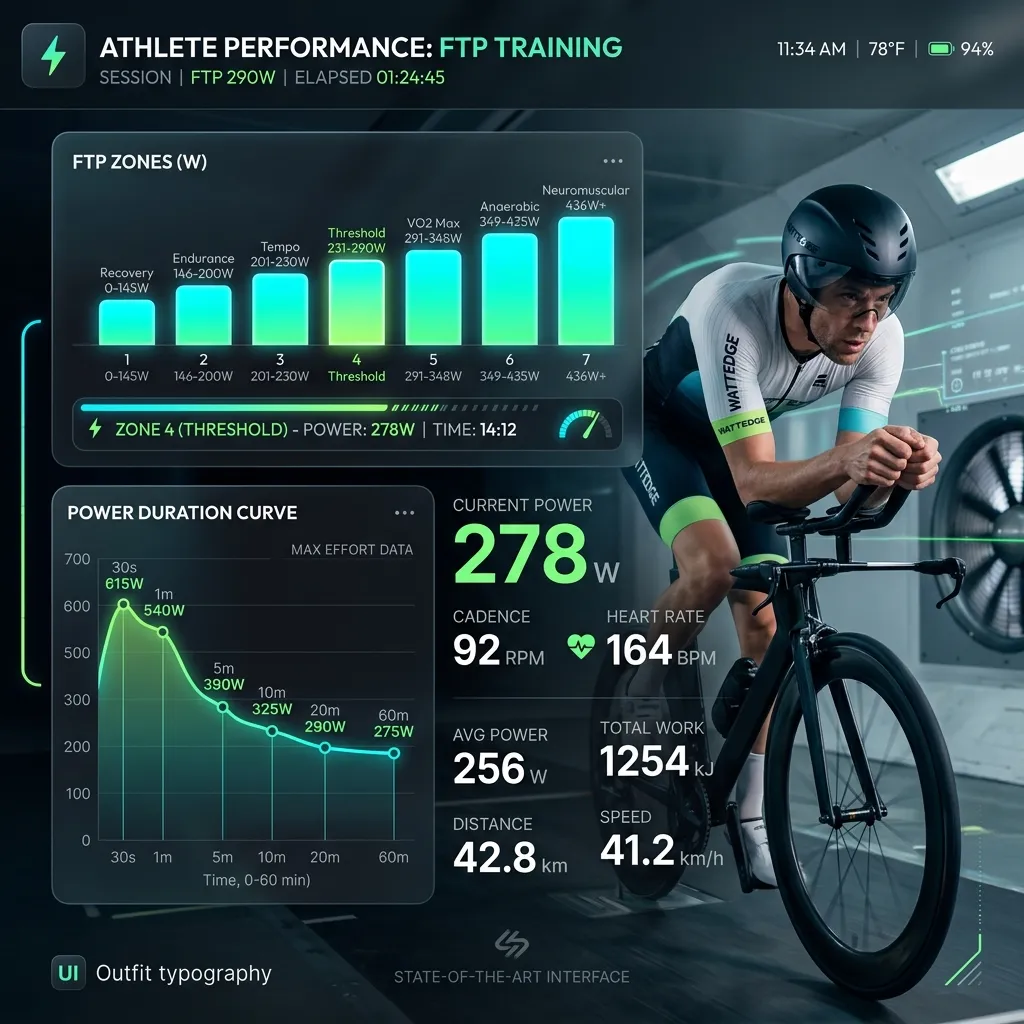
You've invested in a power meter. You've heard coaches talk about "FTP." You see pro triathletes posting watts on social media.
But here is the hard truth that most coaches won't tell you: FTP by itself is just a raw input variable—it is not the controller of your race-day performance.
If you're a triathlete, cycling FTP is merely a baseline capacity metric. On race day, having a 300-watt FTP guarantees nothing. The true controller of your long-course outcome is race execution. To turn your raw FTP into a usable finish-time plan, you need a workflow that accounts for swim fatigue, hills, core temperature, and carbohydrate replenishment limits. That is where the free triathlon bike split calculator, run-off-bike calculator, and main Tri Split Calculator help turn power targets into transparent planning estimates.
This pillar guide breaks down Functional Threshold Power (FTP) through a search-optimized, coach-level framework, showing you:
- What FTP in triathlon really measures (and what it doesn't)
- How to test your FTP specifically for multi-sport pacing
- Practical training-zone ranges to consider for Ironman vs. 70.3 preparation
- The ultimate bike pacing strategy to protect your running legs
- How to model your power input to achieve your target marathon split
Whether you're new to power training or refining your approach for a PR, this guide shifts your perspective from raw numbers to systematic execution.
Ready to turn your raw FTP input into an execution plan? Use our free Ironman pace calculator to model your perfect 140.6 split. If you are racing half-distance first, use the Half Ironman calculator to test the same bike-run tradeoff over 70.3 miles.
1. What Is FTP in Triathlon?
Simple Definition
Functional Threshold Power (FTP) is the highest average power (in watts) you can sustain for approximately one hour without fatiguing.
Think of it as your "metabolic ceiling"—the boundary between efforts you can maintain aerobically and those that force your body into unsustainable anaerobic territory.
Crucial Real-World Correction: FTP is Not a Fixed Physiological Breakpoint
While the traditional definition is a useful guide, experienced coaches know that FTP is a practical training anchor, not a fixed physiological threshold. Here is the reality of sports physiology:
- Estimate vs. Hard Limit: FTP is a mathematical/functional estimate. Your metabolic boundaries fluctuate daily based on fatigue, glycogen status, heat load, sleep, and the testing duration model used (e.g., 20-min test vs. Ramp test).
- The Durability Difference: Two triathletes can have an identical FTP of 280 watts on a 20-minute ramp test, yet possess completely different long-course profiles. Athlete A might have deep aerobic durability to hold 78% of FTP for a 5-hour ride and run a strong marathon, whereas Athlete B (who has highly developed anaerobic capacity) might collapse at mile 10 off a 70% bike split.
- Fueling Dependency: Sustainable power over multiple hours is governed heavily by muscle glycogen storage, gut absorption capacity, and fat oxidation efficiency—factors that standard short-duration FTP testing completely ignores.
The Science Behind FTP
FTP correlates closely with two key physiological markers:
| Marker | What It Means | Connection to FTP |
|---|---|---|
| Lactate Threshold (LT2) | The intensity where lactate production exceeds clearance | FTP typically occurs at or just below LT2 |
| Maximal Lactate Steady State (MLSS) | Highest effort where blood lactate remains stable | FTP is a practical field estimate of MLSS |
Why this matters: Training at or near FTP improves your body's ability to clear lactate, delay fatigue, and sustain higher power outputs over time.
Why Two Athletes with Identical FTP Can Have Very Different Ironman Outcomes
A common trap in long-course triathlon is believing that having a 300W FTP guarantees a faster bike-run split than someone with a 270W FTP. This ignores the shape of the individual metabolic curve, muscular endurance, and athlete phenotypes.
Athlete A: The "High Diesel" (Aerobic Engine)
- 🚴 FTP: 280W
- 🧬 Phenotype: Exceptionally high fat oxidation, deep muscular durability, high percentage of Type I slow-twitch muscle fibers.
- 📊 Metabolic Profile: Can sustain 76% of FTP (213W) for 5 hours while burning mostly fat, leaving carbohydrate stores intact for the marathon.
- 🏃 Marathon Result: 3:35 split. Runs close to their open marathon potential due to low metabolic depletion.
Athlete B: The "High Anaerobic" (Fragile Engine)
- 🚴 FTP: 280W
- 🧬 Phenotype: Highly developed anaerobic glycolytic system, higher percentage of Type IIa fast-twitch fibers, high VLamax (maximum lactate production rate).
- 📊 Metabolic Profile: At 76% of FTP (213W), they burn carbs at an unsustainable rate, accumulating high sub-clinical systemic fatigue and depleting glycogen rapidly.
- 🏃 Marathon Result: 4:25 split. Forced to walk/run due to severe cellular energy depletion ("bonking").
Key Takeaway: FTP is a poor indicator of fractional utilization (what % of threshold you can hold for hours) and substrate usage. Aerobic efficiency and durability are what dominate long-course racing. These pacing ranges assume normal conditions and good fueling—deviation increases exponentially, not linearly.
FTP vs. Other Metrics: What's the Difference?
| Metric | Measures | Best For | Limitation for Triathletes |
|---|---|---|---|
| FTP (watts) | Sustainable power output | Pacing, training zones, race planning | Doesn't account for cumulative fatigue from swim/run |
| Threshold HR | Cardiovascular effort at lactate threshold | Monitoring effort when power isn't available | Lags behind effort; affected by heat, dehydration, caffeine |
| Pace (mph/kph) | Speed over ground | Flat courses, time trials | Misleading on hills, wind, or technical courses |
| RPE (1-10) | Perceived exertion | Quick effort checks, mental pacing | Subjective; hard to quantify for precise planning |
Key insight: FTP is the most objective, actionable metric for bike pacing—but it works best when combined with HR and RPE for holistic race execution.
The "Functional" in FTP: Why It's Not Just a Lab Number
Unlike lab-tested VO₂ max or lactate thresholds, FTP is designed to be measured in the real world:
- On your own bike
- On your usual training roads or trainer
- With your normal equipment and positioning
This makes FTP highly practical for triathletes who need race-ready data, not just physiological curiosity.
Pro Tip
FTP isn't static. It changes with fitness, fatigue, altitude, and even time of day. Test it 2-3 times per year and adjust training zones accordingly.
2. FTP vs. Cycling FTP: The Critical Long-Course Distinction
The Triathlon-Specific Challenge
A pure cyclist races for 3-6 hours. A triathlete races the bike leg after a 2.4-mile swim and before a 26.2-mile run.
This changes everything about how you use FTP:
| Factor | Cyclist Approach | Triathlete Approach |
|---|---|---|
| Bike intensity | Can push 90-95% FTP for time trials | Must hold 70-85% FTP to preserve run legs |
| Nutrition focus | Fuel for bike performance only | Fuel for bike + run performance |
| Pacing strategy | Negative splits often optimal | Even effort or slight positive split preferred |
| Fatigue management | Recover after race | Must run a marathon immediately after |
How FTP Becomes a Race Plan (Using the Tri Split Calculator)
Understanding the theory of FTP is useful, but translating it into a highly actionable, second-by-second race plan is where victories are made. Our free Tri Split Calculator takes your baseline threshold and converts it into custom race outputs instantly.
A Live Example: From FTP to Race-Day Strategy
- 🚴 Baseline FTP: 250 Watts
- 🌡️ Expected Weather: 85°F / 80% humidity
- ⏱️ Swim Time: 1:15:00
- 🚴 Target NP: 178 Watts (71% IF)
- ⏱️ Bike Split: 5 hours, 32 minutes
- 🏃 Marathon Split: 4 hours, 02 minutes
A conservative athlete might manually reduce target bike intensity from 75% to roughly 71% IF when heat and humidity are high, then check the run target with the heat pace and run-off-bike calculators. This is a planning adjustment, not an automatic physiological guarantee.
This metabolic relationship shows why FTP is your ultimate pacing governor. Instead of looking at speed, a triathlete uses FTP-derived Intensity Factor as a strict safety barrier to prevent hitting T2 fully depleted.
The Power-Duration Curve: Why One Hour Doesn't Tell the Whole Story
FTP represents ~1-hour power. But an Ironman bike leg takes 4.5-7+ hours.
This is where the power-duration curve becomes critical:
Short Duration (1-5 min): High power, anaerobic dominant
Medium Duration (20-60 min): FTP zone, mixed aerobic/anaerobic
Long Duration (2-7+ hours): Sub-FTP, aerobic dominant, fuel-dependent
For Ironman: You'll race at 70-85% of FTP—not because you can't go harder, but because going harder compromises the run.
Use our Tri Split Calculator to model how different %FTP targets on the bike impact your predicted run performance.
3. How to Test Your FTP: The Triathlete-Specific Protocol
Why Standard FTP Tests Can Fail Triathletes
Many cyclists use a 20-minute all-out test and multiply by 0.95 to estimate FTP. But for triathletes, this has pitfalls:
- Too anaerobic: 20-minute efforts recruit more fast-twitch fibers than Ironman racing
- Ignores durability: Doesn't account for fatigue from prior swim or training load
- Timing issues: Testing too close to race season can cause unnecessary fatigue
The Triathlete-Friendly FTP Test Protocol
Best timing: 8-12 weeks before your key race, during a base or build phase.
Pre-test prep:
- 48 hours easy training prior
- Familiar warm-up route or trainer session
- Same equipment/position as race day (if possible)
Option A: 2x20-Minute Test (Most Accessible)
- Warm-up: 20 min easy spinning + 3x1-min high-cadence drills
- First 20-min effort: All-out sustainable effort (target ~FTP)
- Rest: 10 min very easy spinning
- Second 20-min effort: Repeat; this is your test effort
- Calculate: Average watts of second effort × 0.95 = Estimated FTP
Why the second effort? It better reflects sustained aerobic capacity after initial fatigue.
Option B: Ramp Test (Best with Smart Trainer)
- Warm-up: 10-15 min easy
- Ramp protocol: Power increases by 20-30W every minute
- End point: When you can no longer maintain cadence despite max effort
- Calculate: Highest 1-minute average power × 0.75 = Estimated FTP
Post-Test: Validating Your FTP
Your test number is a starting point—not a final answer. Validate it in training:
- ✅ FTP feels sustainable for 20-30 minutes at RPE 7-8
- ✅ Zone 2 rides (55-75% FTP) feel steady and aerobic
- ✅ Race simulations at target Ironman power (70-85% FTP) feel controlled, not desperate
- ❌ If Zone 2 feels too hard: Your FTP may be overestimated—reduce by 5-10%
- ❌ If you can chat easily at 80% FTP: Your FTP may be overestimated—retest in 6-8 weeks
When to Retest FTP
| Scenario | Recommended Timing |
|---|---|
| Off-season base building | Every 8-10 weeks |
| Pre-race peak (8-12 weeks out) | One final test, then maintain |
| After significant fitness change | 4-6 weeks after new training block |
| Post-race recovery | Wait 2-3 weeks before retesting |
4. FTP Training Zones for Ironman & 70.3 Success
The 7-Zone Power Model (Triathlon-Adapted)
| Zone | % of FTP | Name | Primary Purpose | Ironman Application |
|---|---|---|---|---|
| Z1 | <55% | Active Recovery | Promote recovery, blood flow | Post-brick cooldown, rest days |
| Z2 | 56-75% | Endurance | Build aerobic base, fat adaptation | Primary Ironman bike zone; long steady rides |
| Z3 | 76-90% | Tempo | Improve sustainable power, lactate clearance | Upper-end Ironman bike; hilly sections, race rehearsals |
| Z4 | 91-105% | Threshold | Raise FTP, improve lactate tolerance | 70.3 bike pacing; short Ironman race efforts |
| Z5 | 106-120% | VO₂ Max | Increase aerobic capacity | Off-season; not used in Ironman racing |
| Z6 | 121-150% | Anaerobic Capacity | Improve high-power repeatability | Sprint/olympic training; minimal Ironman use |
| Z7 | >150% | Neuromuscular Power | Develop sprint ability | Rarely used in long-course triathlon |
Discipline-Specific Zone Targets
Ironman (140.6) Bike Strategy:
- Target zone: Z2 (low-mid) to low Z3
- % FTP range: 70-80% for most age-groupers
- Why: Maximizes glycogen sparing, minimizes muscle damage, preserves run capacity
70.3 (Half-Ironman) Bike Strategy:
- Target zone: Mid Z3 to low Z4
- % FTP range: 80-90%
- Why: Shorter duration allows higher intensity while still protecting the run
Sprint/Olympic Bike Strategy:
- Target zone: Z4 to Z5
- % FTP range: 90-105%
- Why: Race duration is short enough to sustain threshold efforts
Sample Weekly Bike Training Using FTP Zones (Ironman Build)
| Day | Workout | Target Zone | Duration | Purpose |
|---|---|---|---|---|
| Mon | Rest or Z1 recovery spin | Z1 | 30-45 min | Promote recovery |
| Tue | Tempo intervals | Z3 | 2x20 min @ 85% FTP, 5 min rest | Raise sustainable power |
| Wed | Brick workout (bike→run) | Z2 | 90 min bike @ 75% FTP + 20 min run | Practice race-day transition |
| Thu | Endurance ride | Z2 | 2-3 hours @ 65-70% FTP | Build aerobic base |
| Fri | Rest or Z1 active recovery | Z1 | 30 min easy | Recover for weekend |
| Sat | Long ride with race efforts | Z2/Z3 | 4 hours: 3h Z2 + 4x5 min Z3 | Simulate race pacing |
| Sun | Long brick (bike→run) | Z2 | 2.5h bike @ 75% FTP + 45 min run | Build run-off-bike durability |
Heart Rate Cross-Reference (For Days Without Power)
| Power Zone | % FTP | Approx. % Max HR | RPE (1-10) |
|---|---|---|---|
| Z1 | <55% | <60% | 1-2 |
| Z2 | 56-75% | 60-75% | 3-4 |
| Z3 | 76-90% | 75-85% | 5-6 |
| Z4 | 91-105% | 85-92% | 7-8 |
| Z5+ | >105% | >92% | 9-10 |
Note: HR lags behind power, especially at effort changes. Use power for precision, HR for trend monitoring.
5. Ironman Bike Pacing Strategy: The Execution System
The Standard Race Metrics: NP, IF, and TSS
In real long-course racing, simply watching your average power is a recipe for a marathon disaster. The gold standard for pacing is tracking three interacting metrics on your bike computer:
- Normalized Power (NP): A weighted average that estimates the physiological cost of your effort, accounting for surges, climbs, and coasting.
- Intensity Factor (IF): A direct ratio of your Normalized Power relative to your FTP (
IF = NP ÷ FTP). This is the master pacing gauge. - Training Stress Score (TSS): The total cumulative physiological fatigue of the bike leg. Many age-group Ironman plans try to keep bike TSS in a controlled range; values above roughly 320 often signal elevated run-risk, especially with heat, hills, or weak fueling.
The Golden Rule: Race at 65-82% IF
Your Ironman bike pacing isn't about hitting a specific speed. It's about staying in the precise Intensity Factor (IF) zone that sets up your run. These ranges assume normal conditions and good fueling—deviation increases exponentially, not linearly.
| Athlete Profile | Target % FTP (IF) | Physiological Rationale |
|---|---|---|
| First-time Ironman / Beginner | 65-72% IF | Prioritize metabolic safety, fat oxidation, and preserving running legs to prevent marathon blowups. |
| Experienced age-grouper | 73-77% IF | Balance bike speed with durable run preparation. Highly realistic for most competitive athletes. |
| Elite / Strong age-grouper | 78-82% IF | Highest realistic long-course pacing; requires outstanding aerobic efficiency and superb gut absorption. |
| Extreme heat/humidity | Reduce targets by 5-8% IF | Cardiovascular drift and metabolic strain lower sustainable pacing targets drastically (even for pro fields). |
| Very hilly course | Target overall 68-75% IF | Manage power variability (VI < 1.05) carefully; surge cap on climbs, recover on descents. |
The FTP-to-Race Output Matrix (Example: 250W FTP Athlete)
Here is exactly how these physiological zones translate into real-world race strategies, wattage targets, and marathon outcomes for a representative athlete with an FTP of 250 Watts:
| Race Strategy | IF Target | NP Target (Watts) | Expected Bike TSS | Marathon Pacing Outcome |
|---|---|---|---|---|
| Conservative / Defensive | 0.68 - 0.70 | 170W - 175W | 250 - 265 | Strong, steady run; negative split highly possible. |
| Standard Age-Grouper | 0.73 - 0.75 | 182W - 188W | 270 - 290 | Balanced bike/run; slight positive split in final 10K. |
| Aggressive / Contender | 0.78 - 0.80 | 195W - 200W | 295 - 315 | Moderate risk of early run leg heaviness; high fatigue. |
| Over-Biking / Danger Zone | 0.82%+ | 205W+ | >325 | Severe muscle glycogen exhaustion; high risk of a walk-heavy run. |
👉 Plug your own FTP into the bike split calculator, then use the heat, cutoff, and nutrition tools to manually refine the race plan.
Normalized Power vs. Average Power: Which Matters More?
- Average Power: Simple mean of all watts during the ride
- Normalized Power (NP): Weighted average that accounts for variability (surges, climbs, coasting)
Why NP matters for Ironman: A ride with constant 200W feels easier than one that fluctuates between 150W and 300W—even if average power is identical. NP better reflects physiological stress.
Race strategy:
- Target your Intensity Factor (IF) based on Normalized Power (NP)
- Accept that Average Power may be 5-10% lower due to descents/coasting
- Use NP to avoid "power spikes" that accumulate fatigue. Power deviations from targets increase metabolic fatigue exponentially, not linearly.
Terrain-Specific Pacing Adjustments
Don't hold the same wattage on every gradient. Adjust intelligently:
| Terrain | Power Adjustment | Technique Tip |
|---|---|---|
| Flat sections | Hold target NP | Focus on aero position; smooth pedal stroke |
| Climbs (<4%) | +5-10% above target | Stay seated; maintain cadence >75 rpm |
| Steep climbs (>6%) | +10-15% but limit duration | Stand briefly if needed; recover on crest |
| Descents | Coast or spin <50% target | Relax grip; recover legs; practice handling |
| Headwinds | Hold target NP; accept slower speed | Tuck aggressively; don't chase watts |
| Crosswinds | Reduce target by 5% | Focus on bike handling over power output |
The "First 30 Minutes" Rule
Adrenaline at T1 is real. Many athletes surge above target power in the first 20-30 minutes of the bike—then pay for it later.
Your strategy:
- First 5 minutes: Spin easy at 60-65% FTP to let heart rate settle
- Minutes 5-30: Gradually build to target zone (70-85% FTP)
- After 30 minutes: Lock into steady-state pacing; trust the plan
Pro tip: Program your head unit to alert you if power exceeds target +5% in the first 30 minutes.
6. The FTP-to-Marathon Performance Link: Protecting Your Run
The Physiology of "Run-Off-the-Bike"
When you transition from bike to run, your body undergoes significant shifts:
- Blood flow redistribution: From cycling muscles (quads) to running muscles (calves, hamstrings)
- Neuromuscular reprogramming: Legs must adapt from circular pedaling to impact-based stride
- Metabolic stress: Glycogen stores are depleted; lactate may be elevated if bike was too hard
Research finding: Athletes who bike above 82% FTP show 12-18% worse running economy in the first 5K of the marathon compared to those who bike at 73% FTP.
FTP as a Predictor of Run Performance
Your bike pacing doesn't just affect how you feel starting the run—it predicts how you'll perform.
| Bike Effort (% FTP / IF) | Predicted Run Impact | Typical Marathon Split |
|---|---|---|
| 65-72% IF | Minimal fatigue; strong negative split possible | Even or negative split |
| 73-77% IF | Moderate fatigue; even pacing achievable | Slight positive split |
| 78-82% IF | Noticeable leg heaviness; discipline required | Moderate positive split |
| 83%+ IF | Significant fatigue; high risk of walk-run | Large positive split or DNF risk |
Aerobic Decoupling: The Ultimate Long-Ride Pacing Validation
How do you actually know if your target Intensity Factor is physiologically sustainable for 112 miles? The answer is Aerobic Decoupling (also known as the Pa:HR ratio).
Aerobic decoupling measures cardiovascular drift—the tendency for heart rate to slowly rise over a long ride even if power output remains completely flat. This occurs due to dehydration, core temperature rise, and the heart beating faster to maintain cardiac output as blood stroke volume declines.
During a 4-to-5 hour steady-state race rehearsal ride, split the ride's active duration into two halves and calculate the relationship between Normalized Power and Heart Rate for each half:
Decoupling % = ((NP/HR Ratio 1st Half) - (NP/HR Ratio 2nd Half)) ÷ (NP/HR Ratio 1st Half)
- Under 5% Decoupling: Your aerobic durability is fully established. Your body can sustain this target power efficiently with minimal cardiovascular strain.
- Over 5-7% Decoupling: Your FTP or your long-ride endurance target is too aggressive. Biking at this target on race day will cause massive cardiovascular drift, high glycogen consumption, and a severe marathon walk-run.
Common FTP → Race Mistakes: A Tale of Two Athletes
To see how raw FTP input interacts with race-day execution, let's look at the classic real-world comparison of two age-groupers with identical thresholds racing the same course. This is the difference between simple linear modeling and physiological reality:
| Metric | Athlete A (The "Hero" Cyclist) | Athlete B (The Smart Pacer) |
|---|---|---|
| Baseline FTP Input | 300 Watts | 300 Watts |
| Bike Pacing Target | 82% IF (246W NP) | 73% IF (219W NP) |
| Bike Split | 4 hours, 50 minutes | 5 hours, 05 minutes (+15 mins) |
| Cumulative Bike TSS | 335 TSS (Critical depletion) | 270 TSS (Aero safety zone) |
| Marathon Run Split | 4 hours, 30 minutes (Walk-Run) | 3 hours, 40 minutes (Even split) |
| Total Time (Bike + Run) | 9 hours, 20 minutes | 8 hours, 45 minutes (35 mins FASTER) |
Athlete A treated FTP as if it guaranteed race-day durability. They rode a blistering 246W NP (82% IF), surging over climbs to maintain speed and ignoring high cardiovascular drift. Exiting the bike in 4:50, they felt excellent in transition. But this aggressive pace raised cumulative stress to 335 TSS and increased late-marathon risk. By mile 8 of the run, their legs were fading; by mile 18, they were walking long stretches at aid stations, recording a painful 4:30 marathon split.
Athlete B understood that FTP is just an input variable, and race execution is the true controller. Using the calculator workflow, they capped their bike effort at a conservative 73% IF (219W NP, 270 TSS), keeping effort drift under control. Despite being passed by many aggressive cyclists early on, they stayed disciplined. They stepped off the bike 15 minutes slower than Athlete A, but with a better chance of running steadily. They ran 3:40 and finished 35 minutes faster than Athlete A overall.
Practical Strategy: The "Run Preservation" Bike Plan
- Set your bike target: 70-75% IF for conservative/moderate, 77-80% IF for aggressive
- Monitor early run cues: First 2 miles should feel "surprisingly good"
- Adjust if needed: If legs feel heavy at mile 3, ease run pace slightly to preserve form
- Trust the process: A "slow" bike that enables a strong run beats a "fast" bike that destroys the marathon
7. Common FTP Mistakes & How to Avoid Them
Mistake #1: Overestimating FTP from a Fresh Test
Problem: Testing FTP after rest, then racing at that power after a 2.4-mile swim.
Fix: Apply a "race-day fatigue factor": reduce test FTP by 3-5% for Ironman pacing targets.
Mistake #2: Ignoring Normalized Power
Problem: Focusing only on average power, missing the fatigue cost of surges.
Fix: Train your head unit to display Normalized Power; use it as your primary race metric.
Mistake #3: Holding Target Power on Every Gradient
Problem: Pushing 200W on a steep climb because "that's the plan."
Fix: Use power ranges, not rigid numbers. Allow +10-15% on short climbs; recover on descents.
Mistake #4: Not Accounting for Heat/Hydration
Problem: Holding target watts in 90°F heat, leading to dehydration and GI distress.
Fix: Reduce target power by 5-8% in hot conditions; prioritize hydration over wattage.
Mistake #5: Using FTP for Pacing but Not Training
Problem: Testing FTP once, then training by feel or HR only.
Fix: Structure key workouts around FTP zones to build race-specific fitness.
Mistake #6: Chasing Higher FTP at the Expense of Durability
Problem: Focusing only on raising FTP number, not on sustaining sub-FTP efforts for 5+ hours.
Fix: Include long Z2 rides and race-pace bricks to build "time at target" endurance.
8. Sample 12-Week Plan to Boost FTP & Durability
Phase 1: Base Building (Weeks 1-4)
Goal: Build aerobic capacity, improve fat adaptation, establish FTP baseline
| Week | Key Bike Workouts | Target Zones | Volume |
|---|---|---|---|
| 1 | 2x Z2 endurance rides (90 min) | 60-70% FTP | 4-5 hrs |
| 2 | FTP test + 2x Z2 rides | Test day + 60-70% FTP | 5-6 hrs |
| 3 | Tempo intervals: 3x15 min Z3 | 75-85% FTP | 5-6 hrs |
| 4 | Long ride: 3h Z2 + brick run | 65-70% FTP | 6-7 hrs |
Phase 2: Build & Specificity (Weeks 5-8)
Goal: Raise sustainable power, practice race pacing, build run-off-bike durability
| Week | Key Bike Workouts | Target Zones | Volume |
|---|---|---|---|
| 5 | Sweet spot: 2x20 min @ 88% FTP | Z3 high | 6-7 hrs |
| 6 | Race simulation: 4h @ 75% FTP + 30 min run | Z2/Z3 low | 7-8 hrs |
| 7 | Hill repeats: 6x4 min climbs @ 90% FTP | Z3/Z4 low | 6-7 hrs |
| 8 | Long brick: 5h bike @ 75% FTP + 45 min run | Z2 steady | 8-9 hrs |
Phase 3: Peak & Taper (Weeks 9-12)
Goal: Sharpen race pacing, reduce fatigue, arrive fresh at start line
| Week | Key Bike Workouts | Target Zones | Volume |
|---|---|---|---|
| 9 | Race rehearsal: Full bike effort @ target power | 75-80% FTP | 6-7 hrs |
| 10 | Maintenance: 2x Z2 rides + short Z3 efforts | 65-80% FTP | 4-5 hrs |
| 11 | Taper start: Reduce volume 40%, maintain intensity | 70-75% FTP | 3-4 hrs |
| 12 | Race week: Light spin, activation efforts | Z1/Z2 only | 1-2 hrs |
9. Frequently Asked Questions
Q: Do I need a power meter to benefit from FTP?
A: Not strictly—but it's highly recommended. Without power, use heart rate zones and RPE as proxies. However, power provides objective, real-time feedback that HR cannot match, especially on variable terrain.
Q: How often should I test my FTP?
A: 2-3 times per year is sufficient for most age-groupers: once in off-season base, once pre-race build, and optionally post-season for progress tracking. Over-testing can cause unnecessary fatigue.
Q: Can I use the same FTP for cycling and running?
A: No. FTP is specific to cycling. For running, use critical speed (CS) or threshold pace. However, the concept of threshold effort applies to both disciplines.
Q: What if my FTP test feels too easy or too hard?
A: Adjust! If you could have gone harder, increase your FTP estimate by 3-5%. If you faded early, reduce it. FTP is a working number, not a permanent label.
Q: How does FTP change with altitude or heat?
A: Sustainable power drops ~1-2% per 1,000 ft above 5,000 ft elevation. In extreme heat (>85°F/29°C), reduce target power by 5-8% to account for cardiovascular strain and hydration demands.
Q: Should I train at FTP to raise FTP?
A: Yes—but strategically. Include 1-2 sessions per week at or near FTP (Z3/Z4) during build phases. But prioritize Z2 volume for Ironman; threshold work is the spice, not the main course.
Q: How do I know if I'm pacing correctly on race day?
A: Use a three-check system: (1) Power meter for objective output, (2) Heart rate for physiological trend, (3) RPE for perceived effort. If all three align with your plan, you're on track.
10. Tools to Build Your Power-Based Race Plan
Understanding FTP is step one. Executing a personalized, course-specific power strategy is step two.
Tri Split Calculator vs. Generic Estimators & Garmin Pacing
Most athletes rely on their Garmin race predictor or generic online calculators. Here is why those tools fail on race day compared to the Tri Split Calculator:
| Feature / Capability | Garmin / Generic Estimators | Tri Split Calculator |
|---|---|---|
| Pacing Model | Linear extrapolation (assumes static average speed) | Non-linear physiological decay (models energy-to-fatigue curve) |
| Bike-to-Run Pacing Tradeoff | Ignored (treats bike and run as isolated events) | Yes, through a separate run-off-bike durability calculator |
| Environmental Adjustment | None (assumes room temperature conditions) | Heat pace tool plus simple bike course-profile modifiers |
| Nutrition & Hydration Targets | Generic hourly carbs recommendation | Aid-station planner converts duration into carbs, bottles, gels, and sodium |
Embedded Pacing Model (Input → Output Transformation)
Here is a real-world example of how the TriSplitCalc tools turn raw training metrics into a practical race-day planning estimate:
📥 Athlete Inputs
📤 Calculator Outputs
Start planning now: Visit https://trisplitcalc.com/ to build a free, transparent, power-aware Ironman planning estimate.
Disclaimer: This content is for educational purposes. FTP testing and power-based training should be approached progressively. Consult a certified triathlon coach or sports scientist before making significant changes to your training, especially if you have cardiovascular or metabolic conditions. © 2026 TriSplitCalc.com. All rights reserved. Build your power-based race plan at https://trisplitcalc.com/.