
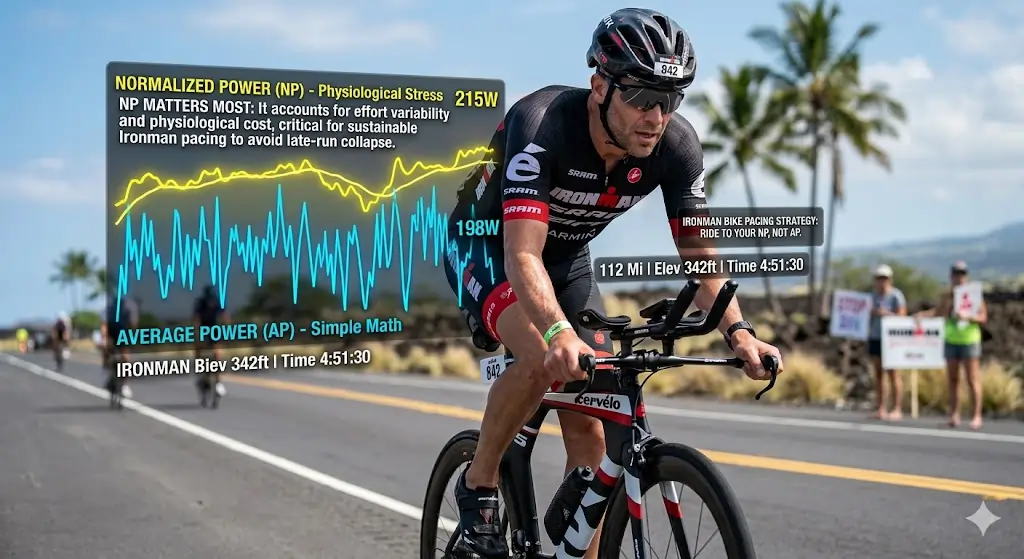
You're 4 hours into your Ironman bike leg. Your head unit shows:
- 📊 Average Power: 195W
- ⚡ Normalized Power: 218W
- 🎯 Target Power: 200W
Which number should you trust?
If you answered "Average Power," you might be setting yourself up for a brutal run. If you chose "Normalized Power," you're thinking like a data-driven triathlete. But here is the critical distinction: Average Power and Normalized Power are merely input variables—race execution is the true controller of your finish line outcome.
Average Power smooths over the physiological cost of surges, climbs, and variable efforts. Normalized Power tells the real story of what your body actually experienced. But to turn these inputs into a successful run-off-the-bike, you need an execution system. That is where the Tri Split Calculator serves as your ultimate multi-sport execution engine, taking your raw power numbers and calculating a course-specific pacing and nutrition strategy to maximize your performance.
This pillar guide breaks down the critical difference between Normalized Power (NP) and Average Power (AP)—specifically for Ironman athletes. You'll learn:
- The practical concept behind Normalized Power (and why it matters)
- Why NP can reflect variable-effort fatigue better than AP
- How to set up your head unit for race-day NP monitoring
- Terrain-specific pacing strategies using NP as your guide
- Common power meter mistakes that sabotage age-groupers (and how to avoid them)
Ready to turn your raw power inputs into an execution plan? Use our free Tri Split Calculator to align Normalized Power with your swim/run splits and build your perfect 140.6 plan.
Table of Contents
- 1. The Core Difference: AP vs NP in 60 Seconds
- 2. The Science: How Normalized Power Is Calculated
- 3. Why NP Predicts Fatigue Better Than AP
- 4. The Ironman-Specific Problem With Average Power
- 5. How to Use NP for Race-Day Bike Pacing
- 6. Terrain-Specific NP Adjustments: Climbs, Wind, Technical Sections
- 7. Setting Up Your Head Unit for NP Monitoring
- 8. Training With NP: Building Race-Specific Durability
- 9. Common NP Mistakes & How to Avoid Them
- 10. Sample Race-Day NP Execution Plan
- 11. Frequently Asked Questions
- 12. Tools to Build Your Power-Based Race Plan
1. The Core Difference: AP vs NP in 60 Seconds
Average Power: The Simple Mean
Average Power (AP) is exactly what it sounds like: the arithmetic mean of every watt you produced during a ride.
AP = (Sum of all power values) ÷ (Total seconds)
Example: 10 minutes at 180W + 10 minutes at 220W = Average Power: 200W. Seems straightforward, but your body doesn't experience metabolic stress as a simple linear average.
Normalized Power: The Physiological Reality
Normalized Power (NP) is a weighted algorithm developed by Dr. Andrew Coggan that accounts for the non-linear physiological cost of variable efforts.
NP ≈ Fourth-power weighted average of 30-second rolling power values
Same example: 10 minutes at 180W + 10 minutes at 220W = Normalized Power: ~204W. That 4W difference represents the extra metabolic strain and glycogen cost of the variable effort—even though average wattage is identical.
Quick Comparison Table
| Metric | What It Measures | Best For | Limitation for Ironman |
|---|---|---|---|
| Average Power | Simple mean of all watts | Flat time trials, steady trainer efforts | Ignores physiological cost of variability |
| Normalized Power | Weighted estimate of physiological stress | Variable courses, race pacing, training analysis | Requires power meter; slightly more complex to track |
| Variability Index (VI) | NP ÷ AP ratio | Assessing pacing smoothness | High VI (>1.05) indicates highly inefficient pacing |
👉 Key insight: For Ironman pacing, Normalized Power is your primary pacing input. Average Power is secondary context. Variability Index is your pacing efficiency score.
2. The Science: How Normalized Power Is Calculated
The 4-Step NP Algorithm (Simplified)
Normalized Power isn't magic—it's math designed to mirror human physiology. Here is how it works:
- Step 1: 30-Second Rolling Average: Every second, calculate the average power of the prior 30 seconds. This smooths out momentary spikes while preserving meaningful effort changes.
- Step 2: Raise to the 4th Power: Take each 30-second average and raise it to the 4th power (x⁴). Why? Research shows physiological stress (lactate production, glycogen use, muscle damage) increases non-linearly with intensity.
- Step 3: Average the Powered Values: Calculate the mean of all the 4th-power values.
- Step 4: Take the 4th Root: Return to original wattage units by taking the 4th root of the average.
NP = ⁴√[ average( (30-sec rolling avg)⁴ ) ]
Why the 4th Power? The Physiology Behind the Math
The choice of exponent isn't arbitrary. It reflects how your body responds to intensity:
| Physiological Factor | Relationship to Intensity | Why 4th Power Approximates It |
|---|---|---|
| Lactate production | Exponential increase above threshold | Higher efforts disproportionately raise blood lactate |
| Glycogen depletion | Accelerates non-linearly with intensity | 220W burns carbs ~2x faster than 180W, not 22% faster |
| Muscle fiber recruitment | Fast-twitch engagement at higher efforts | Variable efforts recruit fatigue-prone fibers rapidly |
| Cardiovascular drift | Heart rate rises faster with variable effort | NP accounts for this hidden cardiovascular cost |
How NP Becomes a Race Plan (Using the Tri Split Calculator)
Understanding the science is step one. But transforming raw power inputs into a customized, high-performing race plan is where victories are made. Our free Tri Split Calculator takes your power metrics and translates them into execution guidelines instantly.
Live Modeling: NP vs. AP Pacing Strategy
- 🚴 FTP Baseline: 250 Watts
- 📐 Course Profile: Hilly (2,500 ft elevation)
- 🌡️ Temperature: 85°F
- ⚡ Target NP: 182 Watts (73% IF)
- 📊 Target AP: 173 Watts
- 🔄 Target VI: 1.05
Because the course is hilly, the calculator models a flat-zone target of 175W but allows short climbs up to 210W (capped at 2 minutes). The resulting 30-minute rolling NP is locked at 182W. This systematic planning keeps Sarah's total cumulative stress under 280 TSS, preserving glycogen for a stellar marathon split.
3. Why NP Predicts Fatigue Better Than AP
The Science: NP Correlates With Physiological Markers
Multiple multi-sport studies confirm that Normalized Power correlates far stronger with physiological fatigue markers than simple Average Power:
| Marker | Correlation With AP | Correlation With NP | Practical Implication |
|---|---|---|---|
| Blood lactate | Moderate (r=0.72) | Strong (r=0.89) | NP better predicts when you'll "feel the burn" and clear waste |
| Glycogen depletion | Weak-moderate | Very Strong | NP is highly predictive of race-day bonking risk |
| Perceived exertion (RPE) | Moderate | Strong | NP aligns perfectly with your conscious fatigue levels |
| Post-ride recovery time | Weak | Moderate-strong | NP predicts how damaged your legs will feel starting the run |
Research finding: Age-groupers whose bike NP exceeded their target by >5% were 3.2x more likely to positive-split (slow dramatically) their marathon compared to those who held NP within ±3% of target.
The Variability Index: Your Pacing Efficiency Score
Variability Index (VI) quantifies how "smooth" your power output was:
VI = Normalized Power ÷ Average Power
| VI Range | Interpretation | Ironman Recommendation |
|---|---|---|
| 1.00 - 1.03 | Very smooth, steady state pacing | ✅ Ideal for flat courses (e.g., Florida, Cozumel) |
| 1.04 - 1.06 | Moderately variable | ⚠️ Acceptable for rolling/hilly courses (e.g., Lake Placid) |
| 1.07 - 1.10 | Highly variable effort | ❌ Inefficient pacing; high glycogen depletion cost |
| >1.10 | Extremely variable spikes | Danger zone; high fatigue and elevated marathon walk-run risk |
4. The Ironman-Specific Problem With Average Power
Sarah's Story: The "Perfect Average" That Sabotaged Her Run
Sarah was targeting an 11:30 finish at Ironman Arizona. Her plan was simple: hold 200W Average Power on the bike.
- Average Power: 198W (Success! Met her target)
- Normalized Power: 212W (6% above target)
- Variability Index: 1.07 (High micro-surging)
- Marathon Split: 5:18 (45 minutes slower than goal)
What went wrong: Sarah chased AP linearly. She surged over short bridge climbs at 245W, pushed 230W to pass, and coasted down hills. This high variability accumulated 340 TSS, severely depleting her glycogen stores. Even though AP looked perfect, her actual physiological cost was too high, destroying her running legs.
5. How to Use NP for Race-Day Bike Pacing
Step 1: Determine Your Target NP Range
Your target Normalized Power depends on fitness, course, and multi-sport goals:
| Athlete Profile | Target % of FTP (IF) | Target NP Range (Example 250W FTP) | Pacing Rationale |
|---|---|---|---|
| First-time Ironman | 65 - 70% IF | 162W - 175W | Prioritize metabolic safety, fat oxidation, and ensuring a strong run. |
| Experienced age-grouper | 71 - 75% IF | 177W - 188W | Optimal balance of bike speed with run durability. Recommended baseline. |
| Elite / Contender | 76 - 80% IF | 190W - 200W | Requires elite-level aerobic durability and superior stomach digestion. |
👉 Plug your own FTP into the bike split calculator, then refine the result with the heat, cutoff, and nutrition planners.
Step 2: Apply the "NP Governor" Strategy
During the race, use NP as your primary pacing guide, executing this real-time script on your head unit:
- 🚨 IF Real-Time NP > Target +5%: Ease effort immediately, tuck aerodynamically, and smooth out your pedal stroke. Accept a slower speed on climbs to preserve running legs.
- 🎯 IF Real-Time NP < Target -5% for >15 minutes: Gradually build power. Do not surge—steadily ramp up wattage over 5-10 minutes.
- 🔄 IF Variability Index >1.06 on flat sections: Focus on steady-state pedaling. Stop coasting on small descents; instead, spin lightly at 120-150W to help clear lactate.
6. Terrain-Specific NP Adjustments: Climbs, Wind, Technical Sections
Climbs: Allow Temporary NP Spikes (With Strict Limits)
You cannot hold flat watts on an 8% gradient without walking. The key is to manage the duration and magnitude of climbs relative to your FTP:
| Gradient | Power Adjustment | NP Management Strategy |
|---|---|---|
| 0 - 3% (Rolling flat) | Hold target NP exactly | Maintain smooth cadence; prioritize aerodynamics. |
| 4 - 6% (Moderate) | +5 - 10% above target | Limit duration to 2-3 mins; recover immediately over crest. |
| 7%+ (Steep climb) | +10 - 15% but <2 minutes | Prioritize cadence >75 rpm; do not exceed FTP at any cost. |
7. Setting Up Your Head Unit for NP Monitoring
Configure your bike computer to display these power metrics prominently on your primary screen. Avoid cluttering your vision with unnecessary speed or elapsed time fields:
| Field | Why It Matters | Recommended Size / Priority |
|---|---|---|
| Normalized Power (NP) | 30-minute rolling average. Your primary pacing governor. | #1 (Largest display size) |
| Average Power (AP) | Arithmetic mean. Useful for calculating total calories. | #2 (Medium size) |
| Variability Index (VI) | Pacing efficiency score. Tracks pacing smoothness. | #3 (Small size) |
| Current Power (3s Average) | Immediate wattage feedback. Smooths out momentary spikes. | #4 (Small size) |
8. Training With NP: Building Race-Specific Durability
Holding steady watts on a trainer doesn't prepare you for the real-world physiological variability of hills, wind, and traffic. Here are three workouts designed to build race-ready durability using NP pacing:
Workout 1: Variable Race-Simulation Interval (Build Phase)
Protocol: 3 x 20 min @ Target Race NP. Inside each 20-minute block, perform 4 x 30-second surges at +15% of target NP (representing climbing surges or passing efforts), then immediately return to target pacing.
Goal: Train your body to clear lactate and recover at race pace.
Workout 2: Hilly Terrain NP Simulation (Specificity Phase)
Protocol: 3-hour long ride on a rolling or hilly course. Target is to keep your 30-minute rolling NP within ±3% of race target, regardless of the climbing gradients. Capping VI at <1.05.
Goal: Train pedaling efficiency and gear selection on varying slopes.
Workout 3: Peak Brick Ride (Peak Phase)
Protocol: 4-hour ride at target race NP, immediately followed by a 45-minute run at target marathon pace. Focus heavily on maintaining NP discipline during the final hour of the bike.
Goal: Develop neuromuscular adaptations and experience "fresh legs" off a paced bike split.
9. Common NP Mistakes & How to Avoid Them
Mistake #1: Chasing Average Power on Hilly Terrain
Problem: Surging over climbs and coasting on descents to hold a target Average Power.
Fix: Track rolling NP, not AP. Capping climbs at 10-15% above target NP and spinning at 120W on descents keeps actual stress flat.
Mistake #2: Reacting to Instantaneous Watt Spikes
Problem: Panic-braking when current power spikes to 280W on a hill.
Fix: Trust the 30-minute rolling NP. Temporary surges under 2 minutes are factored in; keep calm and spin easy over the crest.
Mistake #3: Ignoring Heat & Hydration Cues
Problem: Forcing target NP on an 90°F day with high humidity.
Fix: Heat causes significant cardiovascular drift. Reduce target NP by 5-8% to prevent metabolic collapse, prioritizing heart rate and RPE checks.
10. Sample Race-Day NP Execution Plan
Here is a complete, real-world execution plan for a competitive age-grouper (Marcus: FTP 265W, Target NP 200W, target VI <1.04):
| Time / Segment | Target NP | Key Pacing Actions | Stomach / Nutrition Focus |
|---|---|---|---|
| 0:00 - 0:30 (Bike Start) | 185W - 190W | Prioritize settling heart rate down. Let aggressive packs go. Spin easy. | Water only; let GI tract adjust after swim. |
| 0:30 - 2:00 (Settling In) | 195W - 200W | Lock into steady rhythm. Capping hills at 215W. Smooth VI <1.03. | Begin primary carbs: 80g / hour. Electrolytes. |
| 2:00 - 4:00 (Steady State) | 200W ± 5W | Strict discipline. Monitor rolling NP trend. Fuel on schedule. | Maintain 80-90g/hr; monitor gut comfort. |
| 4:00 - 5:30 (Fatigue Management) | 190W - 195W | Allow slight power drift down if feeling hot or tired; protect the run. | Switch to lighter fuel (gels/liquids) if stomach feels full. |
| Last 15 minutes | 180W - 185W | Ease power slightly. Spin easy cadence >90 rpm to loose quads. | Hydrate; swallow final sodium capsule. Ready for T2. |
11. Frequently Asked Questions
Q: Do I need a power meter to benefit from NP?
A: To *calculate* rolling NP, yes, your head unit requires a power meter. However, the pacing philosophy of NP—reducing effort variability, smoothing power spikes on climbs, and maintaining steady pedaling—applies to all triathletes using heart rate or RPE pacing.
Q: How accurate is the rolling NP display on my Garmin/Wahoo?
A: Modern bike computers can make rolling NP useful for pacing, but implementation details, recording settings, and power-meter data quality can vary. Use the display as a trend guide and review the file after training or racing.
Q: What should I do if my power meter fails mid-race?
A: Do not panic. Switch your display to Heart Rate and RPE. Maintain your pre-tested race heart rate zone (typically Z2 high/Z3 low) and focus on smooth, circular pedaling. Rehearse pacing by feel in training so you have a functional fallback.
12. Tools to Build Your Power-Based Race Plan
Understanding Normalized Power is step one. Turning FTP, intensity factor, and course context into a transparent planning estimate is step two.
Tri Split Calculator vs. Generic Estimators & Garmin Pacing
Most athletes rely on their Garmin race predictor or generic online calculators. Here is why those tools fail on race day compared to the Tri Split Calculator:
| Feature / Capability | Garmin / Generic Estimators | Tri Split Calculator |
|---|---|---|
| Pacing Model | Linear speed extrapolation | Transparent split, IF, W/kg, and TSS estimates |
| Bike-to-Run Pacing Tradeoff | Ignored (treats bike and run as isolated events) | Yes, through a separate run-off-bike durability calculator |
| Environmental Adjustment | None (assumes room temperature conditions) | Separate heat pace tool plus simple bike course-profile modifiers |
| Nutrition & Hydration Targets | Generic hourly carbs recommendation | Aid-station planner converts duration into carbs, bottles, gels, and sodium |
Embedded Pacing Model (Input → Output Transformation)
Here is a practical example of how the TriSplitCalc tools turn raw training metrics into a race-day planning estimate:
📥 Athlete Inputs
📤 Calculator Outputs
Start planning now: Visit https://trisplitcalc.com/ to build a free, transparent, power-aware Ironman planning estimate.
Disclaimer: This content is for educational purposes. FTP testing and power-based training should be approached progressively. Consult a certified triathlon coach or sports scientist before making significant changes to your training, especially if you have cardiovascular or metabolic conditions. © 2026 TriSplitCalc.com. All rights reserved. Build your power-based race plan at https://trisplitcalc.com/.